Pages

Showing posts with label Crystal Reports. Show all posts

Friday, November 25, 2011

Changing Crystal Report Database logon information at runtime in VS2005

Previously in VS2003, table.Location would report "DATABASE.dbo.NAME" and it was possible to use this to change the Location, but in vs2005 table.Location only reports back the NAME.

Using the code

Deploye the attached file and then pass the ReportDocument as argument to CReportAuthentication.Impersonate(ReportDocument Object)from the place where you want to launch the report.
Blocks of code should be set as style "Formatted" like this:
   Imports System.Configuration
Imports CrystalDecisions.CrystalReports.Engine
Imports CrystalDecisions.ReportSource
Imports CrystalDecisions.Shared
Public Class CReportAuthentication
    Public Shared Sub Impersonate(ByVal myRpt As ReportDocument)
        ' Set the login info dynamically for the report
        Dim username As String = ConfigurationManager.AppSettings("ReportUser")
        Dim password As String = ConfigurationManager.AppSettings("ReportPassword")
        Dim Server As String = ConfigurationManager.AppSettings("Server")
        Dim Database As String = ConfigurationManager.AppSettings("Database")
        Dim logonInfo As New TableLogOnInfo

        Dim table As Table

        For Each table In myRpt.Database.Tables
            logonInfo = table.LogOnInfo
            logonInfo.ConnectionInfo.ServerName = Server
            logonInfo.ConnectionInfo.DatabaseName = Database
            logonInfo.ConnectionInfo.UserID = username
            logonInfo.ConnectionInfo.Password = password
            table.ApplyLogOnInfo(logonInfo)
            'Previously in VS2003, table.Location would report "DATABASE.dbo.NAME"  - 
            'and it was possible to use this to change the Location, but in vs2005 table.
            'Location only reports back the NAME.  See below for a fix.
            'http://vstoolsforum.com/blogs/crystal_reports/archive/2007/06.aspx
            table.Location = Database & ".dbo." & table.Name
        Next table
    End Sub
End Class  

Solving the problem of 'Object Instance not created' in asp.net while using Crystal Reports

it is easy to use crystal report in VB.NET or C#.Net. But when using Crystal Report in ASP.Net some problems can occur. One of the problems is the error Object Reference not set.......

Why this happens

This happens because you had not set virtual directory for the Crystal Report viewer, so the viewer can not be initialised.

Solution

The solution for this is simple just create a Virtual directory Named CrystalReportWebFormViewer which is pointing to <Visual Studio installled folder>\Crystal Reports\Viewers (Usually it is C:\Program Files\Microsoft Visual Studio .NET\Crystal Reports\Viewers). Now refresh, and your report will run properly.

How to Pass Parameters to Crystal Reports at Runtime

First of all, create a Crystal Report with the wizard. Now here, I am assuming that you know how to create a Crystal Report though a wizard in VS 2005. Let's suppose we have created the report that is linked to our table WorkOrders in the database.
Now from the Field Explorer, drag and drop the Unbound String Field to Crystal Report. And then from Field Explorer, explore the Formula Fields and right click on that unbound string field and rename that to UBWONo. Then right click on that field in Crystal report and format the object. Then set its font color to white so that it will not display at runtime. So now you have a field on the report that will get the parameter at runtime. But you must pass this parameter field value to the actual database WorkOrderNo field so that we could get the record of that work order number from the database.


Now right click on the database field WorkOrders.BOWONo and click on Select Expert�
And in the Select Expert Dialog Box, give the following parameters:
Now your Crystal Report is ready to get the parameters. Behind the Windows Form from where you are calling the report, in our case you will see the first picture as shown above.
Imports System.Data.SqlClient
Imports CrystalDecisions.CrystalReports.Engine
Imports CrystalDecisions.Shared
Public Class FrmWOVehicleMaint
Public logOnInfo As New CrystalDecisions.Shared.TableLogOnInfo()
Private Sub btnPrint_Click(ByVal sender As System.Object, ByVal e As System.EventArgs) _
        Handles btnPrint.Click
    Me.Cursor = Cursors.WaitCursor
    If SqlConn.State = 1 Then SqlConn.Close()
    Dim frmRept As New FrmReportsDisplay
    Dim oCR As New rptBOWorkOrder
    oCR.DataDefinition.FormulaFields.Item("UBWONo").Text = "'" & Me.lblWONo.Text & "'"

strSQL = "SELECT VehiclesWorkOrders.BOWONo, VehiclesWorkOrders.DateGiven,  _
        VehiclesWorkOrders.TimeGiven, VehiclesWorkOrders.VehicleNo, _
        VehiclesWorkOrders.Mileage,VehiclesWorkOrders.DateComplete, _
        VehiclesWorkOrders.TimeComplete, VehiclesWorkOrders.TotalDownTime, _
        Employees.FirstName, Employees.MiddleName, Employees.LastName, _
        employees_1.FirstName AS Expr1, employees_1.MiddleName AS Expr2, _
        employees_1.LastName AS Expr3,VehicleCard.VehicleType, _
        VehicleCard.Manufacturer, VehicleCard.VinNo, _
        VehiclesWorkOrders.Problem, VehiclesWorkOrders.Diagnose, _
        VehiclesWorkOrders.PartsUsed, VehiclesWorkOrders.Remarks  _
        FROM VehiclesWorkOrders  LEFT OUTER JOIN Employees _
        AS Employees ON VehiclesWorkOrders.IssuedBy = _
        Employees.EmployeeID LEFT OUTER JOIN Employees AS employees_1 _
        ON VehiclesWorkOrders.HandoverTo = _
        employees_1.EmployeeID LEFT OUTER JOIN VehicleCard _
        AS VehicleCard ON VehiclesWorkOrders.VehicleNo = _
        VehicleCard.VehicleNo  WHERE VehiclesWorkOrders.BOWONo =_
        " & oCR.DataDefinition.FormulaFields.Item("UBWONo").Text
        Dim cmd As New SqlCommand(strSQL, SqlConn)
        Dim DA As New SqlDataAdapter(cmd)
        Dim DS As New DataSet
        DA.Fill(DS, "VehiclesWorkOrders,Employees,Employees_1,VehicleCard")
        DT = DS.Tables(0)
        SqlConn.Open()
        oCR.SetDataSource(DS)
        frmRept.CRViewer.ReportSource = (oCR)
        logOnInfo = oCR.Database.Tables(0).LogOnInfo
        logOnInfo.ConnectionInfo.ServerName = mServerName
        logOnInfo.ConnectionInfo.DatabaseName = mInitialCatalog
        logOnInfo.ConnectionInfo.UserID = mUser
        logOnInfo.ConnectionInfo.Password = mPassword
        oCR.Database.Tables(0).ApplyLogOnInfo(logOnInfo)
        frmRept.Show()
        SqlConn.Close()
        Me.Cursor = Cursors.Default
    End Sub

Creating Reports with SQL Reporting Service and Visual Studio .NET

Introduction

The following article will give you a quick start on how to use the new reporting service of Microsoft inside your ASP.NET Application. It is relatively very easy to use reporting services, however it is a bit different from what we are used to in Crystal reports.

Background

Reporting service is basically a reporting server that uses SQL server as its backend database, all reports are deployed on the reporting server and from their you can access any reports you have access rights to. The basic idea is to have a single location where all reports are deployed, and provides a single point of access, this created a very flexible environment to deploy your reports over the enterprise. The idea is a very similar to Crystal Reports Enterprise Reporting.

Requirements:

You will need the following tools before installing the reporting service, those tools are needed for development of reports for deployment you will need exactly the same environment without Visual Studio .NET
  • SQL Server 2000 with SP3
  • IIS 5.0 or 6.0
  • Visual Studio .NET

Accessing Report Server Management Interface:

You can start by accessing your reporting service by going to http://localhost/reports this is where you can manage your reporting service. You can view reports and other information directly from this web interface, manage subscriptions, security, data sources and other. Mostly we won't be using it in this article except for viewing reports.

The Reporting Service Web Management provides browsing folders that contain reports, data source names that you have deployed. This tool provides viewing of reports, however for developing reports you must have Visual Studio .NET

The above figure shows the report server windows service, as you can see it must be running to be able to access, view and deploy reports from your development tool
As I write this article I heard from Microsoft that they have bought a tool that can provide creating reports directly from the reporting service web interface, I do not have any information when it will be released but hopefully soon.

Developing Your Own Reports

1. Creating Your First Report

First you create a new project, and select Report Project this will create a reporting service project. From here you will find two folders shared data sources, and reports. Shared data sources is one very interesting feature, this is where your data source for your reports. You can have more than 1 shared data source or even a single data source for every report, however it wouldn't be a good idea to repeat the same data source twice if you are using the same database.

2. Creating a Shared Data Source

Here just create a shared data source selecting your SQL server, Northwind database, we will be using basically the Northwind database to build a very simple report to list all our customers.

3. Selecting Data

Before selecting the data for your report, just click on new report and choose the wizard, it will take you step by step. First select the data source that you have just created, then select the table, choose any table you like, in this example I chose the customer table. Then select tabular, and then select all data fields into the detail list box. After you are done, go to the Data Tab of your report you will find table customer, with all fields select here you can alter the table or fields you want to select in your report, just as you are used to when creating a view in SQL Server.

4. Selecting Design

After you are done selecting the data go to, report designer select the layout tab in your report, as you can see in the left toolbox you can use any of the report control to enhance your report functionality and design. You can include charts, images, matrix, etc.. after you're done lets preview the report.

5. Previewing Report

One of the features I love about the reporting service, is the ability to preview your report before deployment, here you can view your report as if you are in the deployment environment.

6. Deploying Report on Report Service

The deployment part is tricky now, you do not just include a reporting customer control in your ASP.NET page and that's it, well you have to first deploy them on your reporting service Server. Ok now as we said all your reports are developed on Visual Studio .NET then they are deploying to a reporting server, either on your machine, intranet, or internet anywhere you want them as long you have access rights to that reporting server. To start deployment right click your application and select properties, the following window will appear. You will find the property "OverwriteDataSources" to be false, make it to true, then select the target folder, this can be anything you like. Then enter the location of your reporting server here it is localhost however it can be a domain, IP address or any location you want as long as reporting service is installed to it. After you are done press F5 or right click the project and select deploy, the minute this is done your reports are deployed on your reporting server.

7. Viewing Report from Report Service

As I said now your report is deployed on the reporting server you can access it directly by going to http://localhost/reports , select the folder you installed the report in then select your report. The report should appear like the one shown below:

8. Including ReportViewer Custom Control in your ASP.NET Application

Now the tricky part on how to include this report in your ASP.NET application, here you will need to use a custom control however, Microsoft does not provide a custom control like crystal report viewer custom control, in fact you will find it deployed in the samples directory of Reporting service. The custom control is located at
C:\Program Files\Microsoft SQL Server\MSSQL\Reporting Services\Samples\Applications\ReportViewer
You can just go and open that project and compile it and use the ReportViewer DLL in your ASP.NET application. This can be done by opening your toolbox, then click Add/remove and click browse and select the ReportViewer.DLL I included the source and the DLL in the source in case you cannot find it or you didn't install the sample applications of reporting service. Anyway after selecting the DLL you have to select the custom control from the list as shown below:
You will find the name of the Custom Control ReportViewer "Microsoft Sample Report Viewer Application"
When you are done, just include the custom control in your ASP.NET page and change the following properties.
  • First you have to select the report path and this should be something like :- My Reports/Report1 - exactly the sample folder you deployed your reports in.
  • Second you have to edit the ServerURL and here you enter your reporting service location http://localhost/reportserver/ this is the reporting server location, while /reports is the report server web management so take care not to get mixed up.
Once both are done, you can start viewing your report by accessing your ASP.NET web page.

9. Viewing your ASP.NET Application, including your Report

Now enter the location of your web application and choose the asp.net page that contains the custom control, and bingo here you find your report as shown below. See how easy

Loading Crystal Report reports which use Stored Proc in C#


When I started working on Crystal Reports, mainly I was wondering about these problems:
  1. How to set parameters of stored procedure from C# code using Crystal's APIs.
  2. How to avoid popup window which comes when we use DSN with SQL Server authentication.
  3. How to avoid these errors:
    • Missing prompting unit
    • The parameter is incorrect
This article gives a solution to all of the above issues and also gives a few notes to avoid unpredictable results.

Using the code

The attached code here loads the "SalseReport.rpt" file. The steps to run the attached application are:
  1. Create database say "testDB" in SQL Server and execute the script "SalseData_Table_SP.sql" in the SQL Server Query Analyser which will create a stored procedure "Sel_SalesData" and a table "SalesData" for you.
  2. Import the sample data to the table "salseData" from file "SalesData_Data.txt" (data is comma separated).
  3. Create a DSN named "TestDB_DSN" with SQL Server authentication. Give valid user name and password.
  4. Open "frmSalseData.cs" file and update the below line with your logon information, in the function "btnPreview_Click".
    //The parameters are in the order 
    
    //- UserName, Password, DSN Name, DatabaseName, Case Sensitive
    
    reportDocument.SetDatabaseLogon("pchitriv", "Windows2000", 
                               "TestDB_DSN", "testDB", false);
  5. In case you have created a DSN with some other name than "TestDB_DSN", then open the "SalseReport.rpt" file from the Reports directory and set the DataSource location to point to the correct DSN and "Sel_SalseData" stored procedure again.
  6. The code to load the report looks like this:
    private void btnPreview_Click(object sender, System.EventArgs e) 
    {
        //Instantiate variables
    
        ReportDocument reportDocument = new ReportDocument();
        ParameterField paramField = new ParameterField();
        ParameterFields paramFields = new ParameterFields();
        ParameterDiscreteValue paramDiscreteValue = new ParameterDiscreteValue();
    
        //Set instances for input parameter 1 -  @vDepartment
    
        paramField.Name = "@vDepartment";
        //Below variable can be set to any data 
    
        //present in SalseData table, Department column
    
        paramDiscreteValue.Value = "South";
        paramField.CurrentValues.Add(paramDiscreteValue);
        //Add the paramField to paramFields
    
        paramFields.Add(paramField); 
    
        //Set instances for input parameter 2 -  @iSalseYear
    
        //*Remember to reconstruct the paramDiscreteValue and paramField objects
    
        paramField = new ParameterField();
        paramField.Name = "@iSalesYear";
        paramDiscreteValue = new ParameterDiscreteValue();
        paramDiscreteValue.Value = "2004";
        paramField.CurrentValues.Add(paramDiscreteValue);
    
        //Add the paramField to paramFields
    
        paramFields.Add(paramField); 
    
        crystalReportViewer1.ParameterFieldInfo = paramFields;
    
        reportDocument.Load(@"..\..\..\Reports\SalseReport.rpt");
    
        //set the database loggon information. 
    
        //**Note that the third parameter is the DSN name 
    
        //  and not the Database or System name
    
        reportDocument.SetDatabaseLogon("pchitriv", "Windows2000", 
                                   "TestDB_DSN", "testDB", false);
      
        //Load the report by setting the report source
    
        crystalReportViewer1.ReportSource = reportDocument;
    }

Crystal Reports: Fix for "Load report failed" error.

The problem: You want to display a Crystal Reports file programmatically on your website. When you try to open the report -- say, by calling the Load(Path) method of a ReportDocument object -- your code throws an exception with the message Load report failed. The inner exception reports Invalid file name, but you have verified that the path points right at a valid .rpt file. Perhaps the report mechanism worked just fine until you made some seemingly unrelated changes that affected system permissions.

The fix: When Crystal Reports opens a file, it uses the Windows temporary folder (typically C:\Windows\Temp\) as a scratch-pad. You need to give Crystal Reports explicit permission to read and write to this folder.

How-to: Under XP, ASP.NET runs CR under ASPNET; with most of the Windows Server flavors, CR runs as NETWORK SERVICE. Make sure that this identity has permission to read and write to the Windows temporary folder.

Further: This issue seems to be limited just to ASP. In my office, we have CR embedded in several Windows Forms applications and have never had any problems. At a guess, CP runs with the permissions of the app's user, who automatically has the right access. We ran into this problem when our report server was demoted from being a domain controller, which reset things. I can't guarantee that this tip will work, but it may help prevent a very frustrating few days with your boss demanding hourly when the report server will be back on line.

In some cases in a Windows From Application (.NET environment) when a report is loaded, a copy of it is created in Windows Temp folder and after a while the Temp folder does not allow the new copies of report to be created.
In this situation, emptying Temp folder is helpful and will solve the problem.

Working with Crystal Reports in .Net


Overview
This article will walk through some of the functionalities in crystal reports and how to bind a report in visual studio .Net.
First section covers the functionalities in crystal reports and second section covers how to integrate crystal reports with .Net.

Create a Simple Application

Create a Web Application and Add a Crystal Report

1. Open the Visual Studio .Net.
2. On the File menu, click New then click Website.
Sample screenshot
3. Right click on solution, click Add New Item then click Crystal Report.
Sample screenshot

Crystal Reports 10.0

Bind Source to Reports

After creating crystalreport (.rpt) file, the first thing to do is set data source to the report.
1. Click on Field Explorer.
2. Right click on Database Fields, click on Database Expert.
3. Click on Create New Connection and select one of the sources.
Sample screenshot
Some of the sources for crystalreport
1. Tables in a database
Bind tables of a database as source to a report using wizard in the crystal reports. Data will be automatically populated in the report.
1. Stored Procedure in database
Create a stored procedure and bind the stored procedure to the report using wizard in the crystal reports.
2. Objects in .Net
Create object in .net and this can be passed as a source to the crystal reports.
3. Xmlschema
Create an xmlschema and bind that schema as a source to the crystal reports.

Sub reports

Sub reports are very much useful in building reports. Segregate the main report into various sub reports.
Main advantage of the sub reports is
1. Same sub report can be useful in multiple reports. Re usability of sub reports can be done.
2. If we segregate main report into sub reports, it will be very simpler to build reports.

Formula Fields

This is a very good option provided by the crystal reports. Formula fields are very much useful to format input data.
Example:
There are two fields �state� and �city� in database. In the report if both fields have to be displayed as comma separated
1. Click on field explorer.
2. Right click on formula fields and click new.
Sample screenshot
3. Give a name to the formula field.
4. Three sections will be visible in the formula workshop
Sample screenshot
4.1. First section contains �Report Fields� and �Database Fields�. �Report fields� contains all the fields which were used in the report. �Database Fields� contains all the fields which were available as data source to the report.
4.2. Second section contains all the functions available.
4.3. Third section contains operators such as �=�,�<� and syntax for variable declaration.
5. In the first section expand data source, table name, and fields will be visible.
6. Double click on �state� and �city� fields. Selected fields will be visible in the intermediate section. Edit the code as shown below.
{Table.City} & ", " & {Table.State}
7. Save the formula field.
8. Place the formula field on crystal reports.
For formula fields, code can be written in two syntaxes.
1. Crystal syntax: This is the syntax is provided by crystal reports.
2. Basic syntax: This is VB syntax.
Change the type of the syntax in the drop down shown in the formula workshop.

Functions in Formula Fields

In the formula workshop one of the sections contains functions available to format formula fields.
Example1:
If input string case has to be changed to proper case use �propercase� function under strings section.
1. Create a formula field.
2. Select �propercase� function under strings section.
3. Double click on the function.
4. Select the �Name� field from the database fields.
5. Double click on the �Name� field.
6. The following code will return input string in proper case.
propercase({Name})
Example2:
If input parameter type has to be converted to currency following convert function will be useful.
1. Create a formula field.
2. Select �ccur� function under strings section.
3. Double click on the function.
4. Select the �Amount� field from the database fields.
5. Double click on the �Amount� field.
ccur({Amount})
Various functions are available according to significance, like mathematical functions were available under �Math� section and strings related functions were available under �Strings� section.

Sections in reports

There are 5 basic sections in reports.
1. Report header
This section will appear on top of the report and only once in a report.
2. Page header
This section will appear on top of the page and only once per page.
3. Detail section
This section allows repetition of data.
4. Page footer
This section will appear on bottom of the page and only once in a report.
5. Report footer
This section will appear on bottom of the report and only once in report.
Crystal report allows adding multiple sections in a report.
1. Right click on any of the section header.
2. Click Insert section below.
Sample screenshot

Show Data of a sub report in Multiple Pages

Each sub report will be like an object. Sub report which contains data will be in a single page, instead of breaking into multiple pages.
1. Right click on sub report.
2. Uncheck keep object together.
Sample screenshot
By this option data will placed in multiple pages.

Group By

This option is similar to the group by option in sqlserver. If data has to be grouped by a particular field this option will be useful.
Example:
There are two fields in data base �month� and �amount�. Requirement is, in the report amount earned has to be shown per month.
1. In the main menu click on crystal reports.
2. Click Reports.
3. Click on Group expert option.
Sample screenshot
4. Select �Month� field from the fields shown.
Sample screenshot
Two new sections will appear in the report, group header and group footer. The use of these sections will be same as header and footer as mention in the sections.

Summary Fields

This is an extended option of group by. We will discuss this option with same example discussed in group by section.
In the example (Discussed in Group By section), after grouping the data according to month, if sum of the amount earned per month has to be displayed this option will be useful.
1. In the main menu click on crystal reports.
2. Click on insert option.
3. Click on summary option.
Sample screenshot
4. Select a database field in the �Choose the field to summarize� drop down.
5. Select an expression from �Calculate the summary� drop down.
6. Click �ok�. Summary field will be added in the report.
Sample screenshot
Note:
To get sum of a field, it should be numeric, if not other than mathematical expressions can be used.

Hierarchal Grouping

This option will be useful to group data hieratically.
Example:
Simple example where this option will be useful is employee manager relation. There are two fields in database.
Employee Manager
Emp1          ---
Emp2          Emp1
Emp3          Emp1
Emp4          Emp2
Emp5          Emp2
Emp6          Emp3
Emp7          Emp3
Emp8          Emp1
Requirement:
Emp1
          Emp2
                  Emp4
                  Emp5
         Emp3
                  Emp6
                  Emp7
         Emp8
Above format shows data in hierarchal relation between employee and manager.
1. First group the data (As discussed in Group By section) on employee field.
2. In the main menu click on Crystal Reports.
3. Click on Report option.
4. Click on Hierarchal Grouping Option.
Sample screenshot
5. Check �Sort Data Hieratically� option.
6. Select a field from �Parent Id field� drop down.
7. Set �Group Indent� as �0.35�.
Sample screenshot
Note:
Manager data should be sub set of employee data.
Data type of both fields should be same.

Build a Cover Page

A simple example for this is, if report name should come at the starting of the report in a separate page
1. Build a sub report which contains report name.
2. Place the sub report in the main report in Report Header section.
3. Right click on the sub report section header.
4. Click on Section Expert option.
Sample screenshot
5. Check �New Page After� option.
Sample screenshot
6. Click �Ok�.
7. This sub report will be added as first page of the report.

Shared Variables

These variables can be accessible globally i.e. through out the report. If a shared variable has been declared in of the sub report, it can accessible in the successive sub reports.
The syntax to declare variables will be available in the operator section of the Formula Workshop.
Example:
1. A report contains two sub reports subreport1, subreport2.
2. Filed amount is useful in subreport2.
3. Declare shared variable in subreport1.
4. Create a formula field in subreport1.
5. Write following lines of code.
shared currencyvar x := {Amount};
6. Use the same variable in subreport2.
7. Declare a shared variable of same data type which was in subreport1.
8. Create a formula field in Subreport2. Write following lines of code.
shared currencyvar z;
shared currencyVar x;
z := x;
9. By above few lines of code value in �x� has been assigned to �z�.
Note:
1. Data type of both the shared variables should be same.
2. Shared variable which are going to access globally should be loaded first. In the above case subreport1 should be loaded first and subreport2 should be loaded later in the main report, because variable declared in the subrerpot1 are going to access globally.

Custom Functions

We can create custom functions apart from the functions available in the formula workshop.
1. In the main menu click on Crystal Reports.
2. Select Report option.
3. Select Selection Formula option.
4. Select Group option.
Sample screenshot
5. Right click on Report Custom Functions.
6. Select New option.
Sample screenshot
7. Following screen will be shown.
Sample screenshot
8. Add following lines of code in the Middle section.
Function Mult(i As number, j as number) As Number
Dim i As number
Dim j As number
Dim expr As number
expr = i * j
End Function
9. Above few lines of code will create a function, which have two input parameters and return a value.
To create functions, code can be written in either crystal syntax or VB syntax. To change the syntax option will be available in the menu of formula workshop.

CrystalReports.Net

Report Document

Namespace required:
Imports CrystalDecisions.CrystalReports.Engine
Reportdocument is the main object through which crystalreports can be accessed.
Reportdocument object will be useful to
1. Load a report.
2. Set data source to a report.
3. Export a report.
Dataset, Datatable, datareader or collection any one of the listed objects can be passed as data source to the report.
Dim report As New ReportDocument()
report.Load("C:\report.rpt")
report.SetDataSource(datatable)

Sub Report

A report can have any number of sub reports. Data source can be set to sub report using the reportdocument object of the main report container.
Dim report As New ReportDocument()
report.Load("C:\report.rpt")
Example:
If the main report contains 3 sub reports,
1. Load report document object with main report (report.rpt) as described in the �Report Document� section.
2. With following lines of code data source can be set to sub reports.
report.Subreports.Item("Subreport1").SetDataSource(datatable1)
report.Subreports.Item("Subreport2").SetDataSource(datatable2)
report.Subreports.Item("Subreport3").SetDataSource(datatable3)
Note:
A sub report can not contain another sub report.

Crystalreportviewer

Crystalreportviewer is useful to view the report on a webpage.After setting datasource to the report and subreports the following code is required to bind the report to Crystalreportviewer.
crystalreportviewer.ReportSource = report

Export to PDF

Namespace required:
Imports CrystalDecisions.Shared
To export a report as a pdf document the following code will be useful.
1. Load report document object with main report(report.rpt).
2. Write following lines of code.
Dim exportOptions As New ExportOptions
Dim diskFileDestinationOptions As New DiskFileDestinationOptions()
Dim formatTypeOptions As New PdfRtfWordFormatOptions()

3.      �diskFileDestinationOptions� is required to set the path and name of the destination file.

diskFileDestinationOptions.DiskFileName = "C:\report.pdf"
4.      �exportOptions� is required to set exporttype and destination file options.

exportOptions.ExportDestinationType = ExportDestinationType.DiskFile
exportOptions.ExportFormatType = ExportFormatType.PortableDocFormat
exportOptions.DestinationOptions = diskFileDestinationOptions
exportOptions.FormatOptions = formatTypeOptions

5.      After setting the type of export and destinationfile options following few lines of cede is required to export the report to the specified destation path.

report.Export(exportOptions)

Access Fields in Reports

Fields in reports can be accessed through .Net.

Example:
   If a field in report has to be enabled or disabled according to input, it can be accessible through code in .Net.
           
report.ReportDefinition.Sections("Section1").ReportObjects("Field1").ObjectFormat.EnableSuppress = True
           
Using Report Definition object, sections in a report can be accessible. Using sections report objects can be accessible. Report object contains all the fields in a section. Object Format contains all the properties available for the fields.

By above few lines of code a field in a report can be enabled or disabled.

References


  1. http://www.crystalreportsbook.com/CrystalReportsXI.asp
  2. http://support.businessobjects.com/communityCS/TechnicalPapers/crnet_exportandprintreport.pdf
  3. http://support.businessobjects.com/communityCS/TechnicalPapers/cr_connection_advantages.pdf

ASP.NET Custom Control + Crystal Report Dynamic Text Format

Introduction

In this post, I describe how to dynamically apply format to Crystal report text. In Crystal Report, you can’t directly change color, font size, Style, alignment, etc. So I have created one custom composite control which helps you to format text object in Crystal report.

Background

In Crystal Report, Text Field object properties like Font size, color, style, etc. can’t change. For this, I used HTML editor but it can’t support some tags. So I decided to create my own control which can format the text from client side.

Using the Code

Here, I have used formula field to show the data in Crystal report.
Sample Image - maximum width is 600 pixels
In the below image, I show how to add display data in formula field.
Sample Image - maximum width is 600 pixels
In the below image, I show how to add formula for font size.
Sample Image - maximum width is 600 pixels
In the below image, I show how to add formula for font style.
Sample Image - maximum width is 600 pixels
In the following image, I show how to add formula for Text Alignment.
Sample Image - maximum width is 600 pixels
In the below image, I show how to add formula for Font Color.
Sample Image - maximum width is 600 pixels
//
// Actual Control and Data format.
//
Sample Image - maximum width is 600 pixels

Final Demo Project Screenshot

Sample Image - maximum width is 600 pixels
enjjjjjjjjjjjjj..............................

Custom Field in Crystal Report


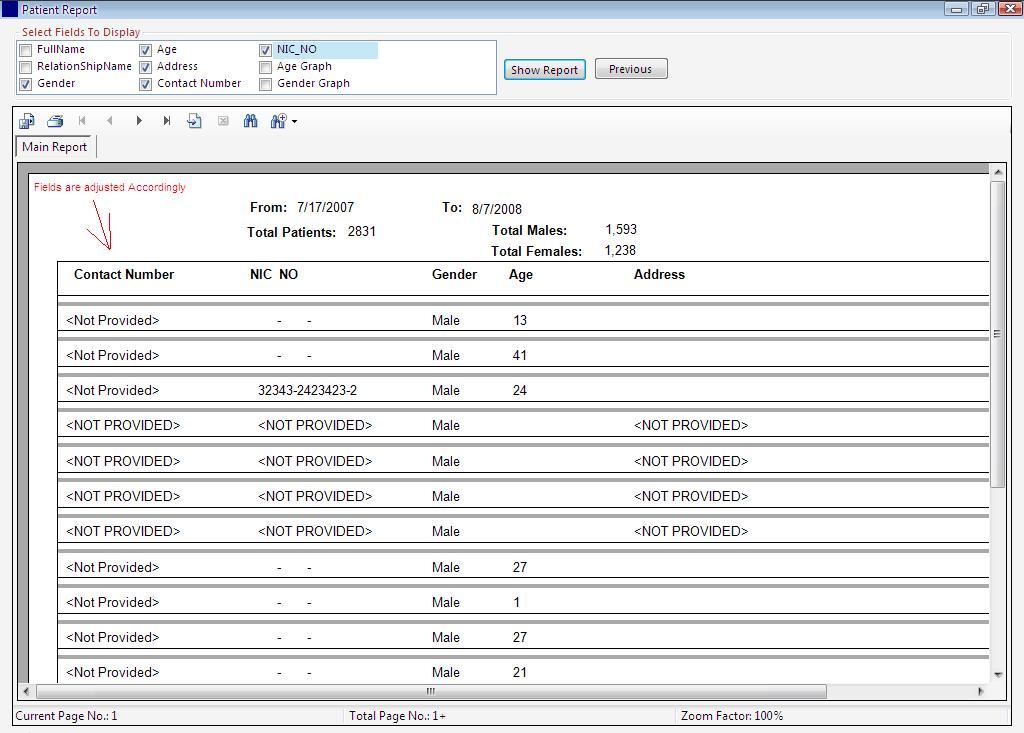
Before Fields adjustment

After Fields adjustment

Introduction

This article will help you understand how to dynamically adjust the fields on the Crystal report that you've already dragged and dropped on the Crystal report during design time and for which, you would like to adjust their position during runtime.

Background

Now-a-days, I'm working in Windows applications in C#. I created a Crystal report and showed that to the client, he was very much satisfied with the working generation of the report. On the very next day, he said that he'd like to see the fields that the user selects. As I'd already spent many days on designing that report, I did not want to change that all over again.
The problem occurs when the user selects the last fields. When the last fields are selected, then the starting fields are left blank. I've searched it on the internet, including The Code Project and many of the search engines, but couldn't find any help regarding this.
So when I solved my problem, I thought I must share this with other people. As this is first version of this article, I expect a lot of suggestions from all of you.

Using the Code

The attached zip file contains all the code needed to run the application. One thing I'd like to mention is that in the sqlregistrationprovider class, don't get confused on seeing the following statements:
SqlDatabase _database = null;
DbCommand _command = null;
I've used Application Blocks, which contain these two classes. You can use ADO.NET objects to do the database related tasks. PatientReport2.cs has lots of bool variables to adjust the fields in Crystal report.
showFields is the function that is used to set the bool values to hide or display the fields on the report, as selected by the user, number of bool in the class is equal to the number of fields in the Crystal reports.
If the user does not want to see the fullname, i.e. if the Fullname checkbox is unchecked, the bool showFullName will be set to false and the following lines of code will hide the field in the Crystal report:
if (!showFullName)
{
  crystalReport21.Section2.ReportObjects["FullName1"].ObjectFormat.EnableSuppress = true;
  crystalReport21.Section2.ReportObjects
 ["FullNameText"].ObjectFormat.EnableSuppress = true;
 }  
FullName1 is the name of the field in the Crystal report's section 3 (Detail Section) and FullNameText is the text/label that will be shown in the report's section 2 (Page Header).
The main function that is doing the work is SetSuppressFields(string, string). It takes two parameters, the first one is the field name under section 2 (Detail Section), and second one is the text under Section 2 (Page Header) of the Crystal report.
One requirement to use this functionality is that you should know all the fieldName (Section 3) and fieldText (Section 2).

If you don't know where to find these names, open the crystalreport-> click on the field and press F4, or right-click on the field and select properties, and note down the (Name) attribute.
 if (!crystalReport21.ReportDefinition.Sections[2].ReportObjects
 ["contactnumber1"].ObjectFormat.EnableSuppress && !contactNo)
            {
                crystalReport21.ReportDefinition.Sections[2].ReportObjects
  ["contactnumber1"].Left = crystalReport21.
  ReportDefinition.Sections[2].ReportObjects[fieldName].Left;
                crystalReport21.ReportDefinition.Sections[2].ReportObjects
  ["contactnumbertext"].Left = crystalReport21.ReportDefinition.
  Sections[2].ReportObjects[fieldText].Left;
                contactNo = true;
            } 
contactNo is a bool variable that shows whether the contactnumber field in the Crystal report is set during runtime or not. By set, I mean that if the starting fields are not shown, then the last fields will be replaced by it, which is also shown in the attached images.

Generate a Report using Crystal Reports in Visual Studio 2010

Since a long time, Visual Basic and Visual Studio have Crystal report with it. People are saying that since 1993. But in VS2010, they excluded Crystal reports. Yes, what you just heard is right, Crystal Report has been dropped from Visual Studio 2010. But don't worry, it is available as a separate download from the SAP web site. These are the things that I found from the internet.
'It turns out that Crystal Reports for Visual Studio 2010 will be released separately, instead of included with the product and Most importantly, Crystal Reports for Visual Studio 2010 will continue to be free, with no registration required.'
Download Crystal report from this link, or just directly paste the link below to your address bar and it will ask to save an EXE file.

Introduction

I was searching the internet for Crystal reports in 2010 and I found in 2005, but was not able to find any particular tutorials for 2010. So I thought, let me take a chance to write it for some beginners like me who have not worked on Crystal Reports earlier.
In this article, I will show you simple report creation process with screenshots. A picture is worth more than a thousand words, so I always believe in an article with screenshots.
Let's start by creating a new website in VS2010. See the following screen:
rsz_1figure_1.jpg
Figure 1
As per figure 1, create a new website in VS2010 and name it as per your choice. Now let me show you the database table structure.
Figure_2.JPG
Figure 2
The above figure shows the db table structure. And the below figure (Figure 3) will show you some sample data in the table:
Figure_3.JPG
Figure 3
If you want to run this sample project directly, then you can download the database script from the link at the top.
Now we have to create an xsd file as a blank data source as we are going to use strong data type. Here I will divide this tutorial in 5 sub sections as mentioned below:
  • Simple report using Crystal Reporting Tool
  • Group report
  • Chart report
  • Sub report
  • Cross tab report

Simple Report using Crystal Report

The below figure shows you the process to create an XSD file.
For adding an XSD file, click on Solution Explorer -> Right Click on Project -> click on Add new Item and then it will show you the below screen.
Figure_4.JPG
Figure 4
Click on the ok button, so it will ask for confirmation to put that file in App_Code folder. Just click ok and that file will open in the screen as a blank screen.
Now we will add one blank datatable to that XSDfile. Just right click on the file and select Add -> Datatable. It will add one DataTable1 to the screen. Figure 5 shows how to add datatable to XSD file.
Figure_5.JPG
Figure 5
Now datatable1 is added to XSD file. Now we will add data column to the datatable1 as per figure 6. Remember whatever fields (columns) we add here, it will be available to show on the report. So add column which you want to display in your reports one by one here.
Figure_6.JPG
Figure 6
Remember to give the exact same name for data column as in database and also select data type which is the same as database, otherwise you will get an error for field and data type mismatch.
Once we add all the required columns in datatable, then set property for the datacolumn as it has in database. The below figure will show you how to set property for data columns. Default datatype for all the columns is string here so if datatype is other than string then only change it manually.
Just right click on the datacolumn in datatable and select property and from property window, select appropriate datatype from DataType Dropdown for that datacolumn.
Figure_7.JPG
Figure 7
That's it. XSD file creation has been done. Now we will move to create Crystal report design.
Just click on the Solution Explorer -> Right click on the project name and select crystal reports. Name it as per your choice and hit the add button.
Figure 8 will show you the creation process of Crystal reports.
Figure_8.JPG
Figure 8
Click on the add button and one .rpt file will be added to the solution. And also, it will ask for the report creation type of how you want to create the report. Figure 9 will show you a screenshot.
Figure_9.JPG
Figure 9
Just click ok button to proceed. It will lead you to figure 10:
Figure_10.JPG
Figure 10
Under project data, expand ADO.NET Datasets and select DataTable1 and add to the selected table portion located at the right side of the windows using > button.
Now click on the Finish button and it will show the next screen (Figure 11):
rsz_figure_11.jpg
Figure 11
Once report file is added, you can see Field Explorer on the left side near server explorer.
Expand Database Fields, under that you will be able to find Datatable that we have created earlier. Just expand it and drag one by one filed from Field Explorer to the rpt file under detail section.
Now the report design part is over. Now we have to fetch the data from database and bind it to dataset and then bind that dataset to the report viewer.
Let's go step by step.
First Drag a CrystalReportViewer control on aspx page from tool box as per below screen:
Figure_12.JPG
Figure 12
Now we will fetch the data, pass data to the dataset and then add that dataset to the Crystal Report. Below is the C# code which will do the job:
using CrystalDecisions.CrystalReports.Engine;
using CrystalDecisions.Shared;
using System.Data;
using System.Data.SqlClient;
using System.Configuration;
Below is the final code for reports:
protected void Page_Load(object sender, EventArgs e)
{
ReportDocument rptDoc = new ReportDocument();
dsSample ds = new dsSample(); // .xsd file name
DataTable dt = new DataTable();
// Just set the name of data table
dt.TableName = "Crystal Report Example";
dt = getAllOrders(); //This function is located below this function
ds.Tables[0].Merge(dt);
// Your .rpt file path will be below
rptDoc.Load(Server.MapPath("../Reports/SimpleReports.rpt")); 
//set dataset to the report viewer.
rptDoc.SetDataSource(ds);
CrystalReportViewer1.ReportSource = rptDoc;
}
public DataTable getAllOrders()
{
//Connection string replace 'databaseservername' with your db server name
string sqlCon = "User ID=sa;PWD=sa; server=databaseservername;
 INITIAL CATALOG=SampleDB;PERSISTSECURITY INFO=FALSE;Connect Timeout=0";
SqlConnection Con = new SqlConnection(sqlCon);
SqlCommand cmd = new SqlCommand();
DataSet ds = null;
SqlDataAdapter adapter;
try
{
Con.Open();
//Stored procedure calling. It is already in sample db.
cmd.CommandText = "getAllOrders";
cmd.CommandType = CommandType.StoredProcedure;
cmd.Connection = Con;
ds = new DataSet();
adapter = new SqlDataAdapter(cmd);
adapter.Fill(ds, "Users");
}
catch (Exception ex)
{
throw new Exception(ex.Message);
}
finally
{
cmd.Dispose();
if (Con.State != ConnectionState.Closed)
Con.Close();
}
return ds.Tables[0];
}hrow new Exception(ex.Message);
}
finally
{
cmd.Dispose();
if (Con.State != ConnectionState.Closed)
Con.Close();
}
return ds.Tables[0];
} 
Now just save everything and run report. It will look like the below figure:
Figure_13.JPG
Figure 13

Grouping in Crystal Report

Here we will see only report design and rest of the things, you can refer from Section 1. Here we will group Customer, Product, Order and Quantity. For details, just go through Figure 14.
Just add a report (.rpt) file to the solution. Select the appropriate dataset from popup window. Once it's done, then select grouping option like figure 14.
Figure_14.jpg
Figure 14
Now, right click on the report, select Report -> Group Experts and the resulting window will look like figure 15:
Figure_15.jpg
Figure 15
Now we want to group like Customer Name and Product name so first add Customer to the right Panel. Then move product name to the right panel like figure 16:
Figure_16.jpg
Figure 16
This time Crystal report design will be different than the previous time. See figure 17.
GroupHeaderSection1 and GroupHeaderSection2 are added to the report designer. Here Group #1 Name refers to Customer Name and Group #2 Name refers to Product Name.
And also GroupFooterSection1 and GroupFooterSection2 are added below if you want to add something to group footer.
Figure_17.jpg
Figure 17
Now under every group, we want to show the number of orders per customer and productwise, so for that, we have to add summary to the GroupFooterSection2. Refer to Figure 18.
Figure_18.jpg
Figure 18
Right Click on the GroupFooterSection select Insert -> Summary. It will show you the next screen (Figure 19). And I have also added Order_ID and Product_Qty field to the detail (section 3) part.
Figure_19.jpg
Figure 19
In summary window, select the column which you want to summarize in the first dropdown.
Select Sum (First option) from the calculate drop down.
Summary Location is already set to the report footer. So just click ok to place that summary field to the report.
By default, Summary field is added to the Report Footer section so move it to the groupFooterSection2 if you want to group product wise, move it to the GroupFooterSection1 if you want to group Customer wise or keep it at original place if you want to sum all ordered products. I have moved to the FooterSection1 so it will show Customer Wise Total Quantity. Refer to Figure 20.
Figure_20.jpg
Figure 20
Now save the report and run it finally. It looks like figure 21.
Figure_21.jpg
Figure 21

Chart in Crystal Report

Chart is the most important and visible part of the reporting tool. Crystal has very powerful feature to add chart in report. Let's see how to add chart in CR. Here also, we will see only designing of the chart for other thing. Please refer to Section 1.
Here we will show customer wise product ordered quantity in chart. X portion will display Customer name and Y portion will display customers total ordered quantity.
First add charts to the report design.
Right click on the .rpt file and select Insert->Chart. Refer to figure 22.

Figure_22.jpg
Figure 22
Once you add chart to the report, it will not show chart on the report file but with mouse pointer you can see one blank rectangle is moving. So just click on the Report header. It will open popup for chart style and other options. Refer to figure 23.
Figure_23.jpg
Figure 23
Now from type tab, select type of the charts like bar chart, line chart, pie chart, etc. form the left side. Select sub type from the right pane like side by side chart, percentage bar chart, etc. I am not going into the detail of it. I am leaving it for you to practice work.
And also select vertical or horizontal radio button from the below section if you want to change the chart style vertically or horizontally. Check Use depth effect check box if you need shadow effect on the graph. Refer to figure 23.
Figure_24.jpg
Figure 24
As per figure 24, move to the next tab data. There are three boxes, available fields, on change of and show values. So move Customer Name from available fields to on changes of box, and move Product Quantity filed to the show value box and click ok.
Now you can see chart is added to the report header section as per figure 25.
Figure_25.jpg
Figure 25
Now, just save the report and run it. You can see a Report as a chart on the screen.

Report Inside Report (Sub Report)

Crystal reports provide reports inside report feature which are normally known as a subreport feature.
Let me explain it in detail. Here also, we will design only sub report design. For rest of the things, refer to Section 1.
Add new report to the solution. Then add Report->Group and select only Customer name because we want to design report for each customer and sub report product wise. So there will be only one group header inside the Customergroup header as per figure 26.
Figure_26.jpg
Figure 26
Now right click on Detail section and select Insert->Subreport. Refer to figure 27.
Figure_27.jpg
Figure 27
Once we add subreport, it will show screen like figure 28.
Figure_28.jpg
Figure 28
As per figure 28, by default, choose a Crystal Report in project is selected if you want to add report from the project, then otherwise select create a subreport with the report wizard. Once we select create a subreport with Report Wizard (3rd radio button), we have to click on the Report Wizard button to select report type and data source just do as Part - 1 first. Then click on ok button so like chart report it will show a moving rectangle around mouse, click on the detail section where you want to show subreport.
Now to edit the sub report, refer to figure 29.
Figure_29.jpg
Figure 29
Click on the edit subreport option and format the report as per your need. Here I will suggest add product name and product quantity or you can add chart also for sub report. When you click on the subreport button, it will open subreport designer, actually CR will create a separate .rpt file but it will remain hidden inside the main .rpt file so we can't see it..
Now run the report and you can see the result, report inside report like figure 30.
Figure_30.jpg
Figure 30
Here number 1 is the main report and number 2 is the subreport it's showing title as Product wise.

Cross Tab Report in Crystal Report

First, let me make it clear as to what is a Cross tab report. Normally, we generate report row wise like first we show customer name, then product wise, etc. But suppose we want to see report as column wise like product name should be displayed as column in report, then cross tab report comes into the picture. See result of Cross Tab report in figure 31.
Figure_31.jpg
Figure 31
Here also, I will show how to design cross tab report only, for rest of the things, refer to Section 1.
First add .rpt file to the solution. Then add cross report to the Report Header section as per the below figure (Refer to figure 32).
Remember we can add cross tab report only in Report header or report footer section.
Figure_32.jpg
Figure 32
Once we click on cross tab report options, it will show moving rectangle around mouse pointer just place it to the report header section.
As we click on header section, it will lead to the figure 33.
Figure_33.jpg
Figure 33
As per the figure, move Customer name field to the Rows section, Product name we want to show as a Column so move it to the Columns fields, and we want to show product total so move it to the summarized fields. That's it. Just run the report and you can see the output as shown in figure 31.
It's as simple as that. If you have any queries regarding any type of the above mentioned reports, please let me know by way of comments. I will try my level best to fulfill your request.
Let's enjoy reporting!